Friday 26 December 2014

General and Advanced ETL Testing Interview Questions

ETL Testing Interview Questions

General Questions

• What is a three tier data warehouse?
• What are OLTP and OLAP?
• Who are the participants of data warehouse testing?
• What is Master data management?
• Mention what are the types of data warehouse applications and what is the difference between data mining and data warehousing?
• Explain what is tracing level and what are the types?
• Explain what is Grain of Fact?
• What is MDM (Master data management) ?
• What is Full load & Incremental or Refresh load?


General ETL Interview Questions

• What is ETL?
• What is ETL process? How many steps ETL contains?
• Why ETL testing is required?
• What are ETL tester responsibilities?
• Explain ETL testing life cycle?
• Explain ETL Mapping Sheets?
• How many types of ETL Testing?
• Mention few Test cases and explain them
• How to prepare test cases for ETL / Data Warehousing testing?
• How many types of Bugs in ETL?
• Explain what are the ETL testing operations includes?
• What are the various tools used in ETL?
• How to fine tune mappings?
• What are the differences between SQL Override and Update Override?
• Data Warehouse Testing vs Database Testing
• Who are the participants of data warehouse testing

Advanced ETL interview Questions

• In your project you are using which type of data base and how much space ?
• What is tracing level? How many types of transformations supported by sorted input?
• If there are ten thousand records in a source system, how do we ensure that all ten thousand are loaded to the target without any dysfunctional values?
• I have ten records in my source system but I need to load only 2 records to the target for each run. How do I do this?
• Give some examples of real time data warehousing

Monday 13 October 2014

How to remove recent projects from Visual Studio Start up Page

                By default the Recent Projects list on the Start Page automatically displays the last six solutions you edited, from newest to oldest. Use this procedure to remove solutions that you do not want to appear in this list

To remove items from the Recent Projects list, follow these steps:

1. Close Visual Studio if it’s running.
2. Start --> Run…


3. Start the Registry Editor (run regedit)


4. Navigate to this registry key by using following screen to understand the Registry Editor

5. Click on HKEY_CURRENT_USER from the Registry Editor

6. Select Software in HKEY_CURRENT_USER

7. Choose Microsoft Folder in Software

8. Select Visual Studio in Microsoft Folder

9. Choose 9.0 in Visual Studio Folder

10. Click on ProjectMRUList in 9.0 Folder

11. Select items and Delete it 
              
                 Finally I remind u if needed reorder your list.File1, File2 etc. And delete all items or a selected item in the list depends on Ur opinion. For Example I delete File4, then only projects corresponding to File1 to File3 will be displayed in the recent project list.

Friday 26 September 2014

Creating SSIS Packages

Introduction
     In this article, I will explain that how many ways to creating packages.
Description
     By using two ways to create package

•   By using the built in Import and Export Wizard in SQL Server 2008, which asks you about moving data from source to a destination and then automatically generates an SSIS package. After you create a package in the wizard, you can execute it immediately, schedule it, or associate it with an SSIS project.
How to Import data by using Import & Export Wizard )

•   By explicitly creating a package inside an SSIS project in BIDS. BIDS in SQL Server 2008 uses the Microsoft Visual Studio 2008 interface. Within the BIDS development environment, you first create as SSIS project and then create and develop new packages.
 ( Creating SSIS Project in BIDS )

Creating an SSIS Project in BIDS

Creating an SSIS Project
          Although the Import and Export Wizard is useful for generating a quick package that moves data from one source to one destination, these packages are frequently use one time of solution only at the time of starting point. But presently we will need to either develop a package that has more complicated requirements or create a set of coordinated packages. That reason you first need to create a new SSIS Project in BIDS.

            To import data from Excel and stored into Sql server by using BIDS Development tool, we have to do the following steps to create new SSIS package.

Steps:
1. Start --> Programs --> Microsoft SQL Server 2008 R2--> SQL Server Business Intelligence Development Studio (BIDS)

2. In BIDS, choose New, Project from the file Menu. (If you have Visual Studio 2008 installed separately from BIDS, you can simply select New Project from File Menu)

3. Fill out the New Project dialog box as follows:
• Under Project Types, select Business Intelligence Projects.
• Under Templates, select Integration Services Project.
• Assign a name to your Project in the Name box.
• In the Location box, either leave the default folder location for storing new Projects (Default is \Documents\Visual Studio 2008\Projects\folder) or change to location of your choice.

4. When you have finished, Click OK to build the Project. The project contains several SSIS Objects as shown below Diagram.

5. In this above Diagram shows a new project, with the default Package.dtsx package (created with the project) in the SSIS Designer. In Solution Explorer, right click of that package and then click Rename.

6. At the time of rename of package, BIDS might prompt you to rename the package object. If a message box appears that prompts you to rename the package object is well, click Yes.

7. Click the Save button on the toolbar, and then close the package by clicking the Close button in the upper right corner of the SSIS Designer.

8. Finally you are now ready to Configure and Develop your Package.

Wednesday 24 September 2014

How to Import Data by using Import and Export Wizard in Sql Server 2008

Using the Import and Export Wizard
          With SQL Server 2008, you use the Import and Export Wizard to copy data without going through the process of creating an SSIS Project. Use the following considerations to determine which part of the wizard to use:
•  Importing data with the wizard lets you bring data from various sources like flat files, data in Microsoft Office Excel spreadsheets or Microsoft Office Access databases or data in Oracle databases into a SQL Server tables.
•  Exporting data with the wizard lets you send data from SQL Server tables, views or custom queries to flat files or another database.

To import data from Excel and stored into Sql server by using Import and Export Wizard in SQL Server 2008, we have to do the following steps.
Steps:
1. Start --> Programs --> Microsoft SQL Server 2008R2 --> SQL Server Management Studio (SSMS)
2. Open SQL Server Management Studio
3. Provide the details of the server you wish to manage as well as the appropriate username and password (if you’re not using Windows Authentication)


4. Click Connect to connect to the server from SSMS
5. Right-click on the name of the database instance you wish to use and select “Import Data” from the Tasks menu


6. Click Next to advance past the wizard’s opening screen


7. Choose Microsoft Excel as your data source
8. Click the Browse button, locate the abc.xls file on your computer, and click Open

9. Verify that the “First row has column names” box is checked

10. Click Next to advance past the Choose a Data Source screen
11. On the Choose a Destination screen, select SQL Server Native Client as the data source
12. Choose the name of the server that you want to import data into from the Server Name drop-down box.
13. Verify the authentication information and select the options corresponding to your SQL Server’s authentication mode.

14. Choose the name of the specific database you want to import data into from the Database drop-down box
15. Click Next to continue
16. Click Next to accept the “Copy data from one or more tables or views” option on the Specify Table Copy or Query screen

17. In the Destination drop-down box, choose the name of an existing table to import the data into a table that already exists in your destination database or type the name of a new table that you wish to create. In our example, we will use this Excel spreadsheet to create a new table called “Sheet1”

18. Click Next to move past the Select Source Tables and Views screen is displays by click on Preview Button.

19. Select both Check boxes of Run Immediately & Save SSIS Package then Choose File System and select “Do not save sensitive data” in Drop down list

20. Click Next to save package in Specific location with specific name.

21. Click the Finish button to skip ahead to the verification screen
22. After reviewing the SSIS actions that will take place, click the Finish button to complete the import.


23. It shows Execution status screen, click the Close button.

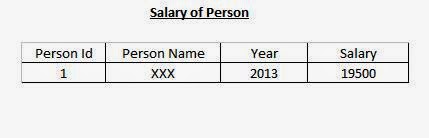
24. Finally to check data in SSMS (Sql Server Management Studio) as shown below.

         In general, the import and Export Wizard provides a quick way to move data from one Source to Destination for one time use, but there are some limitations:

•  You can specify only one Source and one Destination in the wizard.
•  Advanced workflow precedence is not available through the wizard.
•  The wizard does not share data sources with other packages.

By overcome above limitations you need to develop a new package from scratch in BIDS (Business Integration Development Studio)

Wednesday 23 July 2014

What is Network? & Network Model Diagrams

What is Network?

A Network is a group of two or more devices linked together; this concept is mainly used in computers is called Computer network. In computer networks, networked computing devices pass data to each other along data connections. These connections between nodes are established using either cable media or wireless media.
The best known computer network is Internet.

There are many types of computer networks are shown below
• Local Area Networks (LANs)
• Wide Area Networks (WANs)
• Campus Area Networks (CANs)
• Metropolitan Area Networks (MANs)
• Home Area Networks (HANs)

The computers are arranged in below models
• Star Model
• Bus Model
• Ring Model


Tuesday 17 June 2014

What is a Package in SSIS?

A Package is a core object with in Sql Server Integration Services (SSIS). It contains
• Business logic
• Work flow elements
• Connections

          Business logic to handle the data extraction, manipulation, and transformation tasks needed to move data from one location to another location depends on requirement.
          Workflow elements involve running a stored procedure, moving a file from an FTP server to a destination folder on your server, or sending an email message when an error occurs. The work flow elements are in control flow.
          Connections to connect to different external systems such as databases, files, File Transfer Protocol (FTP) Servers, Simple Mail Transfer Protocol (SMTP) Servers. Connections are used for this SSIS data processing engine called as dataflow.

Finally the package is best parallels an executable program that maintains workflow and business logic. Simply say that a package is a collection of tasks snapped together to execute in an orderly fashion.

Saturday 7 June 2014

Schema & Types of Schemas

Schema

       A schema is a collection of objects such as tables, views, indexes, synonyms. It simply explains the logically diagram of Database and relation between tables by using key attributes. It includes the name and description of records of all record types including all associated data-items and aggregates.

There are four types of schemas are available in data warehouse.


Star Schema with Diagram

Star Schema
·   In Star Schema all dimensional tables are related with One Fact table.
·   The dimension table contains the set of attributes. Each Dimension table has a one to many relationship with Fact table.
·   Simple Star Schema contains only one Fact Table where as a complex star schema contains more than one Fact table.
·   Star schemas are denormalized that reason it retrieve data faster than highly normalized schemas.


     The above diagram explains Simple Star Schema. There is a fact table at the center of location and it contains the keys to four dimensions.


Snow Flake Schema with Diagram

Snow Flake Schema
·      In snow Flake schema also same as star schema like all dimension tables related with Fact table and some of the Dimension table linked with Dimension tables only.
·      One or more dimension tables are partially or completely normalized in Snowflake schema.
·      Snowflake schemas normalize dimensions to eliminate redundancy. That is, the dimension data has been grouped into multiple tables instead of one large table.
·      The main Principle of snowflake is normalization of the dimension tables by removing redundancy of attributes and creating separate tables.


                The above diagram explains that the dimension tables of Customer, Time, Product and Geography are connected to Fact table of FactInternetSales , Product Dimension table related with another dimension table ProductSubcategory.

Extended Star Schema with Diagram

Extended Star Schema

·         In Star Schema Fact tables are connected to Dimension tables only. But Extended Star Schema Fact table is connected to Dimension table and the Dimension table is connected to SID (Surrogate ID) table and SID table is connected to the master data tables.
·         One Fact table connected to 16 Dimension tables, one Dimension table can be assigned with maximum of 248 SID Tables in Extended Star schema.
·         Main Advantage of Extended Star schema is keeping the master data outside of dimension tables , we are able to share the master data across the system there by reducing the need of redundancy of master table.

·         It is mainly used in SAP BW projects for fast loading of data and fast access to reports.

Galaxy Schema with Diagram

Galaxy Schema
·         The Galaxy schema is also known as fact constellation schema. It is combination of star schema and snow flake schema.
·         Galaxy schema contains many fact tables with some common dimension (Confirmed Dimensions)
·         This Schema is a combination of many data marts. One fact table may represent one data mart.


Saturday 31 May 2014

Definition of Table & Cube

Table:
         A table is an arrangement of columns and rows used to organize and position data.


Cube:
         The cube is a multidimensional data structure from which you can query for business information. You build cubes out of your fact data and the dimensions.

Above figure shows a Sales cube that was created from the fact table & dimensions. Consider the front face of the cube that shows numbers. The above cube has three dimensions: Time, Product and State.
It shows sold product information.
Each block of the cube is called a cell and is uniquely identified by a member in each dimension.
For Example, analyze the bottom –left corner cell that has the values 4,784 and $98,399. The values indicate the number of sales and sales amount. This cell refers to sales of product type of Ale in the state of Washington (WA) for July2008.
Notice that some cells do not have any value; this is because no facts are available for those cells in the fact table.

Tuesday 29 April 2014

Unified Dimensional Model in SSAS

UDM (Unified Dimensional Model)

             The UDM is central to your Analysis Services database architecture.UDM is your friend because it helps you narrow the gap between end users and data they need. Analysis Services provides you with features that help you design a model that will serve the needs of end users. It provides you with a way to bring data from multiple heterogeneous sources into single model.

              Pre-UDM versions of Analysis Services only supported one fact table per cube. Therefore, only one data source could be used for specifying the fact table of cube.


Figure: The UDM provides a bridge between end users and their data

                  The above figure shows the architecture of the Unified Dimensional Model that is implemented in Analysis Services. It helps you to integrate data from various data sources such as Oracle, Sql Server, DB2 and TeraData into a single model that merges the underlying schemas into a single schema.To restrict end user view by using concept Perspectives in Analysis Services.
                  In OLAP, the data analyzed by end users is often historical data that might be a few days, months, or even year old. XML for Analysis (XMLA) standard, which allows client tools to retrieve data from Analysis Services. To write OLAP queries retrieve data within a few seconds.

The UDM consists of several components as follows
    • Data source – It represents a connection to the database where the data is stored.
    • Data source view (DSV) - Abstracts the underlying database schema. Although a DSV might seen redundant, it can be very useful by letting you augment the schema.
    • Dimensional Model – After you’ve created a DSV, the next step is to build the dimensional model.

Key elements of the UDM are as follows:
    • Heterogeneous data access support: UDM helps you to integrate and encapsulate data from heterogeneous data sources. It helps you combine various schemas into a single model.
    • Real time data access with high performance: The UDM provides end users with real time data access.     The UDM creates a MOLAP cache of underlying data. It helps in providing real time data access with     the speed of an OLAP database due to MOLAP cache.
    • Rich metadata, ease of use for exploration, and navigation of Data: UDM provides a consolidated view of the underlying data sources with the richness of metadata provided by the OLAP world. End users are able to exploit this Meta data to navigate and explore data in support of marking business decisions.
    • Rich analytics support: UDM provides rich analytics such as Key performance Indicators and Actions that help in understanding your business with ease and automatically take appropriate actions based on changes in data by using MDX (Multidimensional expressions) language.
    • Model for Reporting and Analysis: It provides you with the capability of not only querying the aggregated data that are typically used for analysis, but also has the ability to provide for detailed reporting up to the transaction level across multiple heterogeneous data sources.


Additional Features in Analysis services 2008:
    • In Analysis services 2008, the UDM is tightly integrated with data mining features. You can also create a data mining dimension from data mining model.


      • Several MDX functions are also added in Analysis services 2008.
      • In a dimension that can have hundreds of attributes. But in real time attributes with in dimension are not used in many queries. Only a subset of the attributes might be heavily used. Including unnecessary attributes and hierarchies in your UDM cases performance decreases in some cases.
             The Analysis Services 2008 design tools also allow you to better visualize the relationships between the attributes that you need and help you build a better dimension model. (It’s known as Fine Tuning Dimensions.)

             Merge UDM in Analysis Services 2008 is become a powerful, enterprise class product that you can use to build large scale OLAP databases and implement strategic business analysis applications against those databases.

             Finally you learn about the overall architecture of Analysis Services 2008 followed by the concept of the unified Dimensional Model (UDM), it helps you to have a unified view of your entire Datawarehouse.

Wednesday 9 April 2014

What is Fact or Measure & Types with Examples

Measure or Fact Table
                       Fact tables contain measurements of individual business processes.
It contains two sections in the table
(a) Foreign Keys to Dimensions
(b) Facts or Measures

Fully Additive Facts:
It can be summarized across any and all dimensions information stored in Fact Table.

Example:
Revenue Quantity


Semi Additive Facts:
Semi Additive Facts are Facts that can be summed up for some of the dimensions in the Fact Table.

Example:
Inventory Quantities can be summed up through the model and Dealer dimension but not through the Time Dimension


Non Additive Facts:
                    Non Additive Facts are Facts that cannot be summed across any dimensions in the Fact Table.
All Ratios are Non Additive Facts.

Example:
In the below Diagram shows Margin rate is non additive.

Margin rate=Margin_Amount / Revenue


Fact less Fact Table:
A Fact Table contains no measures or facts that type of Facts are known as Fact less Fact Table. Sometimes store a “1” for convenience.

Example:
A fact table which has only key elements is a fact less fact. There are no measures in this table

What is Dimension & Types of Dimensions with Examples

Dimension Table
                      It is the Master Table of Cube. It contains textual information more and more. Generally
A Specific business information (or) A particular task information is stored in this table. It is a collection
Of Hierarchies, Categories and logics. This can be used for a user to traverse in hierarchical nodes.

Types of Dimensions

Confirmed Dimension
The Dimension which is shared by two or more Fact tables (if it is used in multiple projects) is called as confirmed Dimension.
(Or)
The Dimension which is created only once and it is used in many schemas then it is called Confirmed Dimension.

Example: Customer Dimension can be used across the saving & current Fact Tables in Banking Environment.


Role Playing Dimension
A database Dimension that acts as multiple dimensions with in a cube is called as Role Playing Dimension. From the same table if we have multiple foreign keys in fact tables then the table acts differently for each key attribute.

Example:
Time Dimension is one of the best Example of Role playing Dimension, you can have one Time Dimension called Date and then you can add ShipDate, DueDate and OrderDate as Cube Dimensions.


Junk Dimension

It is a group of flags which gives true or false, yes or no, type of information. The attributes in the junk dimension do not belongs to the fact table. It contains a Unique key for all possible combinations of flags and use that unique key in the fact table.
This is not relegated to any Data warehouse schema and is used only for reference.

Example:


Degenerated Dimension
It is a Dimension which is derived from fact tables and does not have its Entry in Dimension Tables.

Example:


In above table contains Fact Internet Sales information directly taken from OLTP Database. We will create dimension table depends on Fact Table like this


Note: IF number of Rows in Fact Table = Number of Rows in Dimension Table (That time De-Generated Dimension is not possible)

Slowly Changing Dimension
                   * link as shown below *
        Slowly changing dimension & scd-types URL Link

Tuesday 8 April 2014

Slowly Changing Dimension (SCD) & Types of SCD's

Slowly Changing Dimension

Dimension source data may change over time, rather than changing on regular schedule, time base. In Datawarehouse there is need to track changes in dimension attributes in order to report historical data.

Slowly Changing Dimensions are often categorized into three types namely Type1, Type2 and Type3. The Following Example clearly explains the types of SCD’s.


Type 1: Updates existing record with modifications. (Does not Maintains History)

In the year of 2012, if the salary of the person to 19000, then the old values of the columns “Year” and “Salary” have to be updated with the new values. In this Type1, there is no way to find out the old salary of person Person Id – 1 in year 2012 since the table now contains only the new salary and year information.


Type 2: Creating an additional record (Does Maintains History)

In this Type 2, the old values will not be replaced but new values are stored in to another row of table. So at any point of time, the difference the old values and new values can be retrieved from database and early be compared. This is very useful for Real Time for reporting purposes.


Type 3: Creating New Fields. Keep old and new values in the existing row (Requires a design Change)

In this Type 3, the latest update to changed values can be seen. Example mentioned below how to add new columns and maintains old columns of that column changes as shown below.


The problem with the Type3 used in Real Time, if the salary of person1 changes, then added new columns to the same row that type u can change structure of cube every time.